Introduction
Debugging is an important part of WordPress development. Whether you are creating a custom plugin, editing a theme, or troubleshooting a website issue, WordPress error logs help you understand what is going wrong behind the scenes.
By default, WordPress does not show PHP errors directly inside the admin dashboard. You usually need to access the server files using FTP, cPanel File Manager, SSH, or hosting file manager to check the
debug.log
file.
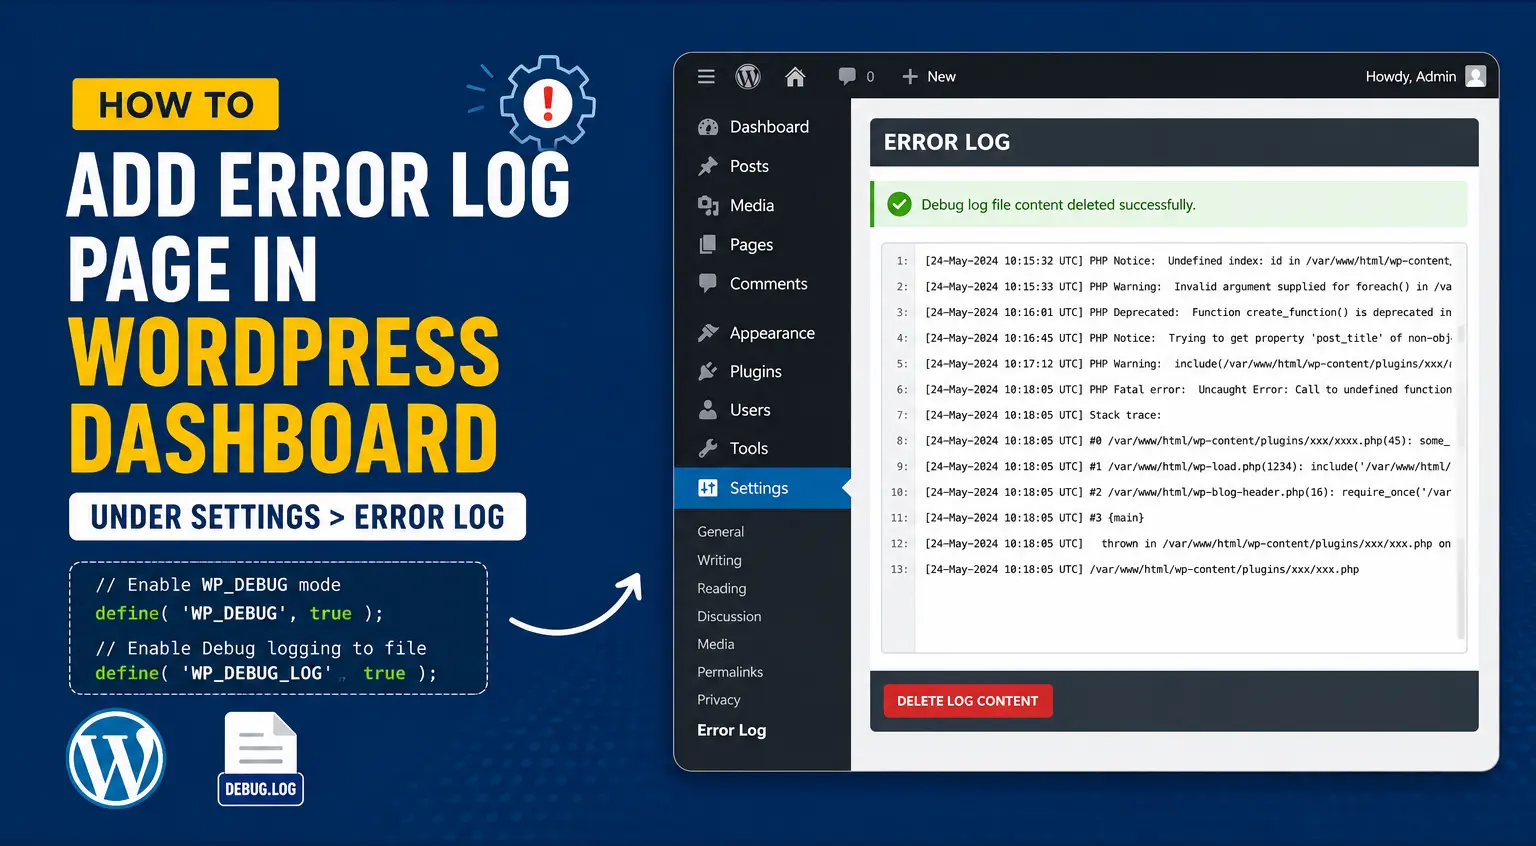
In this tutorial, we will learn how to add a custom Error Log page inside the WordPress dashboard under:
Settings > Error Log
From this admin page, you will be able to view the WordPress debug log directly from the dashboard and also clear the log content using a button.What We Will Create
In this guide, we will create a simple WordPress plugin that:
- Adds a new Error Log submenu under the WordPress Settings menu
- Reads the
debug.logfile from the/wp-content/debug/folder - Displays the error log content inside the WordPress admin dashboard
- Shows line numbers for better readability
- Provides a Delete Log Content button
- Clears the log file content securely using WordPress nonce verification
Why Add an Error Log Page in WordPress Dashboard?
When a WordPress website has PHP warnings, notices, fatal errors, or plugin conflicts, the error details are usually stored in a log file. But checking that file manually every time can be time-consuming.
Adding an error log viewer inside the WordPress dashboard makes debugging easier.
Some benefits are:
- You can view errors without FTP or cPanel
- You can quickly check plugin or theme errors
- You can clear old logs from the dashboard
- You can monitor issues after plugin updates
- It saves time during WordPress development
This method is especially useful when you are developing your own WordPress plugin and want to monitor errors directly from the admin panel.
Step-by-Step Guide
Step 1: Enable WordPress Debug Mode in wp-config.php
wp-config.php file. This file is located in the root directory of your WordPress installation.Find this line:/* That's all, stop editing! Happy publishing. */
Before this line, add the following code:
// Enable WP_DEBUG mode
define( 'WP_DEBUG', true );
// Enable Debug logging to the /wp-content/debug/debug.log file
define( 'WP_DEBUG_LOG', true );
This enables WordPress debug mode and allows WordPress to write errors into a debug log file.
Step 2: Create a Debug Folder and Log File
Now create a folder inside the wp-content directory.
The folder path should be:
wp-content/debug/Inside this debug folder, create a file named:
debug.logSo the final file path should be:
wp-content/debug/debug.logStep 3: Create a WordPress Plugin
Now we will create a custom WordPress plugin.
Go to this directory:
wp-content/plugins/Create a new folder:
wp-dashboard-error-logInside this folder, create a PHP file:
wp-dashboard-error-log.phpSo the final plugin file path will be:
wp-content/plugins/wp-dashboard-error-log/wp-dashboard-error-log.phpStep 4: Complete Plugin Code
Here is the complete plugin code. You can copy this code and paste it inside:
wp-content/plugins/wp-dashboard-error-log/wp-dashboard-error-log.php<?php
/**
* Plugin Name: WP Dashboard Error Log
* Plugin URI: https://example.com/
* Description: Adds an Error Log page under Settings menu to view and clear the WordPress debug log.
* Version: 1.0.0
* Author: Your Name
* Author URI: https://example.com/
* License: GPL2
* Text Domain: wp-dashboard-error-log
*/
if ( ! defined( 'ABSPATH' ) ) {
    exit;
}
if ( defined( 'WP_DEBUG_LOG' ) && WP_DEBUG_LOG ) {
ini_set( 'error_log', WP_CONTENT_DIR . '/debug/debug.log' );
}
// Hook to add the submenu under the Settings menu
add_action( 'admin_menu', 'add_error_log_submenu' );
function add_error_log_submenu() {
add_submenu_page(
'options-general.php', // Parent slug (Settings)
'Error Log', // Page title
'Error Log', // Menu title
'manage_options', // Capability
'error-log', // Menu slug
'display_error_log' // Callback function to display the error log
);
}
// Callback function for displaying and clearing the debug log
function display_error_log() {
echo '<div class="forguard-wrap" style="padding: 20px 20px 20px 0px;">';
// Get the path to the debug.log file
$debug_log_path = WP_CONTENT_DIR . '/debug/debug.log';
// Check if the form is submitted for deletion and nonce is verified
if ( isset( $_POST['delete_debug_log'] ) && check_admin_referer( 'delete_debug_log_action' ) ) {
// Check if the file exists before deleting its contents
if ( file_exists( $debug_log_path ) ) {
// Clear the contents of the debug.log file
file_put_contents( $debug_log_path, '' );
echo '<div class="notice notice-success" style="margin:0; margin-bottom:5px;"><p>Debug log file content deleted successfully.</p></div>';
} else {
echo '<div class="notice notice-error" style="margin:0; margin-bottom:5px;"><p>Debug log file not found.</p></div>';
}
}
// Display the admin page title
echo '<h1 style="margin:0;background-color:#4d4d4d;color:#fff;padding:10px;font-size:20px;text-transform:uppercase;">' . esc_html( get_admin_page_title() ) . '</h1>';
// Check if the debug.log file exists and display its content
if ( file_exists( $debug_log_path ) ) {
$log_content = file_get_contents( $debug_log_path );
// Split the log content into an array of lines
$log_lines = explode( "\n", $log_content );
// Output the form with a "Delete Log Content" button
echo '<form method="post" style="font-family:Helvetica, Arial, Sans-serif, Verdana, Tahoma;margin:0;color:#4D4D4D;padding:0;box-sizing:border-box;line-height:1.5;">';
// Add a nonce for security
wp_nonce_field( 'delete_debug_log_action' );
echo '<input type="hidden" name="delete_debug_log" value="1">';
// Display log content in a scrollable box with line numbers
echo '<div style="display:flex;font-family:Helvetica, Arial, Sans-serif, Verdana, Tahoma;margin:0;color:#4D4D4D;box-sizing:border-box;line-height:1.5;">';
echo '<div style="font-family:Helvetica, Arial, Sans-serif, Verdana, Tahoma;margin:0;color:#4D4D4D;box-sizing:border-box;line-height:1.5;flex:1;overflow:auto;background-color:#fff;padding:20px;height:400px;border:1px solid #ccc;">';
foreach ( $log_lines as $lineNumber => $lineContent ) {
echo '<div style="display:flex;gap:4px;font-family:Helvetica, Arial, Sans-serif, Verdana, Tahoma;padding:0;box-sizing:border-box;line-height:1.5;">';
echo '<span style="color:#97a2ac;font-family:Helvetica, Arial, Sans-serif, Verdana, Tahoma;padding:0;box-sizing:border-box;line-height:1.5;">' . esc_html( $lineNumber + 1 ) . ': </span>';
echo esc_html( $lineContent );
echo '</div>';
}
echo '</div>';
echo '</div>';
// Output the "Delete Log Content" button
echo '<div class="debuglog-button" style="margin:0;font-family:Helvetica, Arial, Sans-serif, Verdana, Tahoma;color:#fff;padding:10px;box-sizing:border-box;line-height:1.5;background-color:#4d4d4d;">';
echo '<input style="font-size:11px;text-transform:uppercase;padding:5px;font-weight:700;color:#fff;background-color:#E52E50;border:none;border-radius:2px;box-shadow:0px 8px 15px rgba(0, 0, 0, 0.1);transition:all 0.3s ease 0s;cursor:pointer;outline:none;" type="submit" class="button button-secondary" value="Delete Log Content">';
echo '</div>';
echo '</form>';
} else {
echo '<div class="notice notice-info"><p>Debug log file is empty or not found.</p></div>';
}
echo '</div>';
}Unlock Exclusive Content
Enter your email address below to reveal this section immediately.
Step 5: Install and Activate the Plugin
After creating the plugin file, go to your WordPress dashboard.
Then go to:
Plugins > Installed PluginsFind the plugin named:
WP Dashboard Error LogClick on Activate.
After activation, go to:
Settings > Error LogNow you should see your custom Error Log page inside the WordPress dashboard.
Step 6: Test the Error Log Page
To test whether the error log is working, you can create a small PHP warning or notice in your custom plugin or theme file.
For example:
error_log( 'This is a test error log message.' );
After adding this line, refresh your website or admin page.
Then go to:
Settings > Error LogYou should see the test log message inside the error log viewer.
How the Plugin Works
This plugin works in three main parts.
1. It Sets the Error Log Path
The following code sets the error log location:
ini_set( 'error_log', WP_CONTENT_DIR . '/debug/debug.log' );
This means PHP errors will be written inside:
wp-content/debug/debug.log2. It Adds a Dashboard Menu Page
The plugin uses the admin_menu hook and add_submenu_page() function to add a new page under the Settings menu.
add_action( 'admin_menu', 'add_error_log_submenu' );
This creates the menu:
Settings > Error Log3. It Reads and Displays the Log File
The plugin uses file_get_contents() to read the log file content:
$log_content = file_get_contents( $debug_log_path );
Then it splits the log content line by line using:
$log_lines = explode( "\n", $log_content );
After that, it displays each line inside a scrollable box with line numbers.
Security Features Used in This Plugin
This plugin includes some important WordPress security practices.
1. Direct File Access Protection
The plugin uses this code:
if ( ! defined( 'ABSPATH' ) ) {
exit;
}
This prevents direct access to the plugin file from the browser.
2. Admin-Only Access
The menu page uses the manage_options capability:
3. Nonce Verification
Before clearing the log file, the plugin verifies a WordPress nonce:
check_admin_referer( 'delete_debug_log_action' )
This helps protect the delete action from CSRF attacks.
4. Escaped Log Output
The plugin uses esc_html() when displaying log lines:
esc_html( $lineContent )
This prevents raw HTML or JavaScript from being executed inside the admin page.
Important Note About Debug Mode on Live Websites
You should be careful when enabling debug mode on a live production website.
This line enables debugging:
define( 'WP_DEBUG', true );
For development websites, this is fine.
But for live websites, you should avoid showing errors directly to visitors. If you are using debugging on a live website, make sure error display is disabled.
You can add this also in wp-config.php:
define( 'WP_DEBUG_DISPLAY', false );
@ini_set( 'display_errors', 0 );
This prevents errors from being displayed on the frontend while still allowing errors to be stored in the log file.
A safer production setup can be:
define( 'WP_DEBUG', true );
define( 'WP_DEBUG_LOG', true );
define( 'WP_DEBUG_DISPLAY', false );
@ini_set( 'display_errors', 0 );
Recommended File Permission
debug.log file should be writable by WordPress. If the file is not writable, WordPress may not be able to save error logs.Recommended permissions are usually:Folder: 755
File: 644- Folder permission
- File permission
- Server ownership
- Hosting security restrictions
- Whether
WP_DEBUG_LOGis enabled - Whether the plugin is activated
🎯 Common Issues and Solutions
Error Log Page Is Not Showing Under Settings
Make sure the plugin is activated from:
Plugins > Installed PluginsAlso confirm that your logged-in user has administrator access.
Debug Log File Not Found
If you see the message “Debug log file is empty or not found,” check whether this file exists:
wp-content/debug/debug.logIf the file does not exist, manually create the folder and file.
Errors Are Not Being Logged
Check your wp-config.php file and make sure the following lines are added before the final WordPress stop-editing comment:
define( 'WP_DEBUG', true );
define( 'WP_DEBUG_LOG', true );
Also make sure your plugin is active.
Delete Log Content Button Is Not Working
The button clears the content of the log file using:
file_put_contents( $debug_log_path, '' );
If it does not work, the file may not be writable. Check the file permission and ownership.
Best Practices for WordPress Error Logging
Here are some useful best practices:
- Do not keep debugging enabled permanently on production websites
- Clear old logs regularly
- Do not expose the debug log publicly
- Restrict access to administrators only
- Use
WP_DEBUG_DISPLAYasfalseon live websites - Check logs after plugin or theme updates
- Monitor fatal errors during custom plugin development
Final Result
After completing all the steps, your WordPress dashboard will have a new menu page:
Settings > Error LogFrom this page, you can:
- View the WordPress debug log
- Check PHP errors, warnings, and notices
- See log lines with line numbers
- Clear the log file content
- Debug your custom plugin or theme more easily
Conclusion
Adding an Error Log page inside the WordPress dashboard is a useful feature for developers and website administrators. It saves time because you do not need to open FTP, cPanel, or server files every time you want to check the WordPress debug log.
With a simple custom plugin, you can easily add an Error Log page under Settings > Error Log and monitor your WordPress errors directly from the admin dashboard.
This method is especially helpful when you are developing custom WordPress plugins, debugging theme issues, or checking PHP warnings after updates.