Ever stared at your web page thinking, “Who keeps messing with my div!?”
This article is your JavaScript detective kit — no trench coat required.
Introduction
Picture this: you’re debugging a web page and some <div> is changing, disappearing, or mutating like a Marvel character — but you have no clue which JavaScript file is doing it.
Well, Firefox DevTools gives you several awesome features to track these sneaky scripts down. We’ll use tools like:
Break on DOM changes
Call Stack tracing
Debugger search
And of course, the magical
{}Pretty Print for those annoying minified files
Let’s Sherlock Holmes our way through that JavaScript.
1. Find JS Files Using "Break on" Feature
🎯The Goal: Catch JavaScript in the act when it messes with your HTML elements.
🛠️ Steps:
Open Firefox and go to your target web page.
Press
F12to open Developer Tools.Click the Inspector tab.
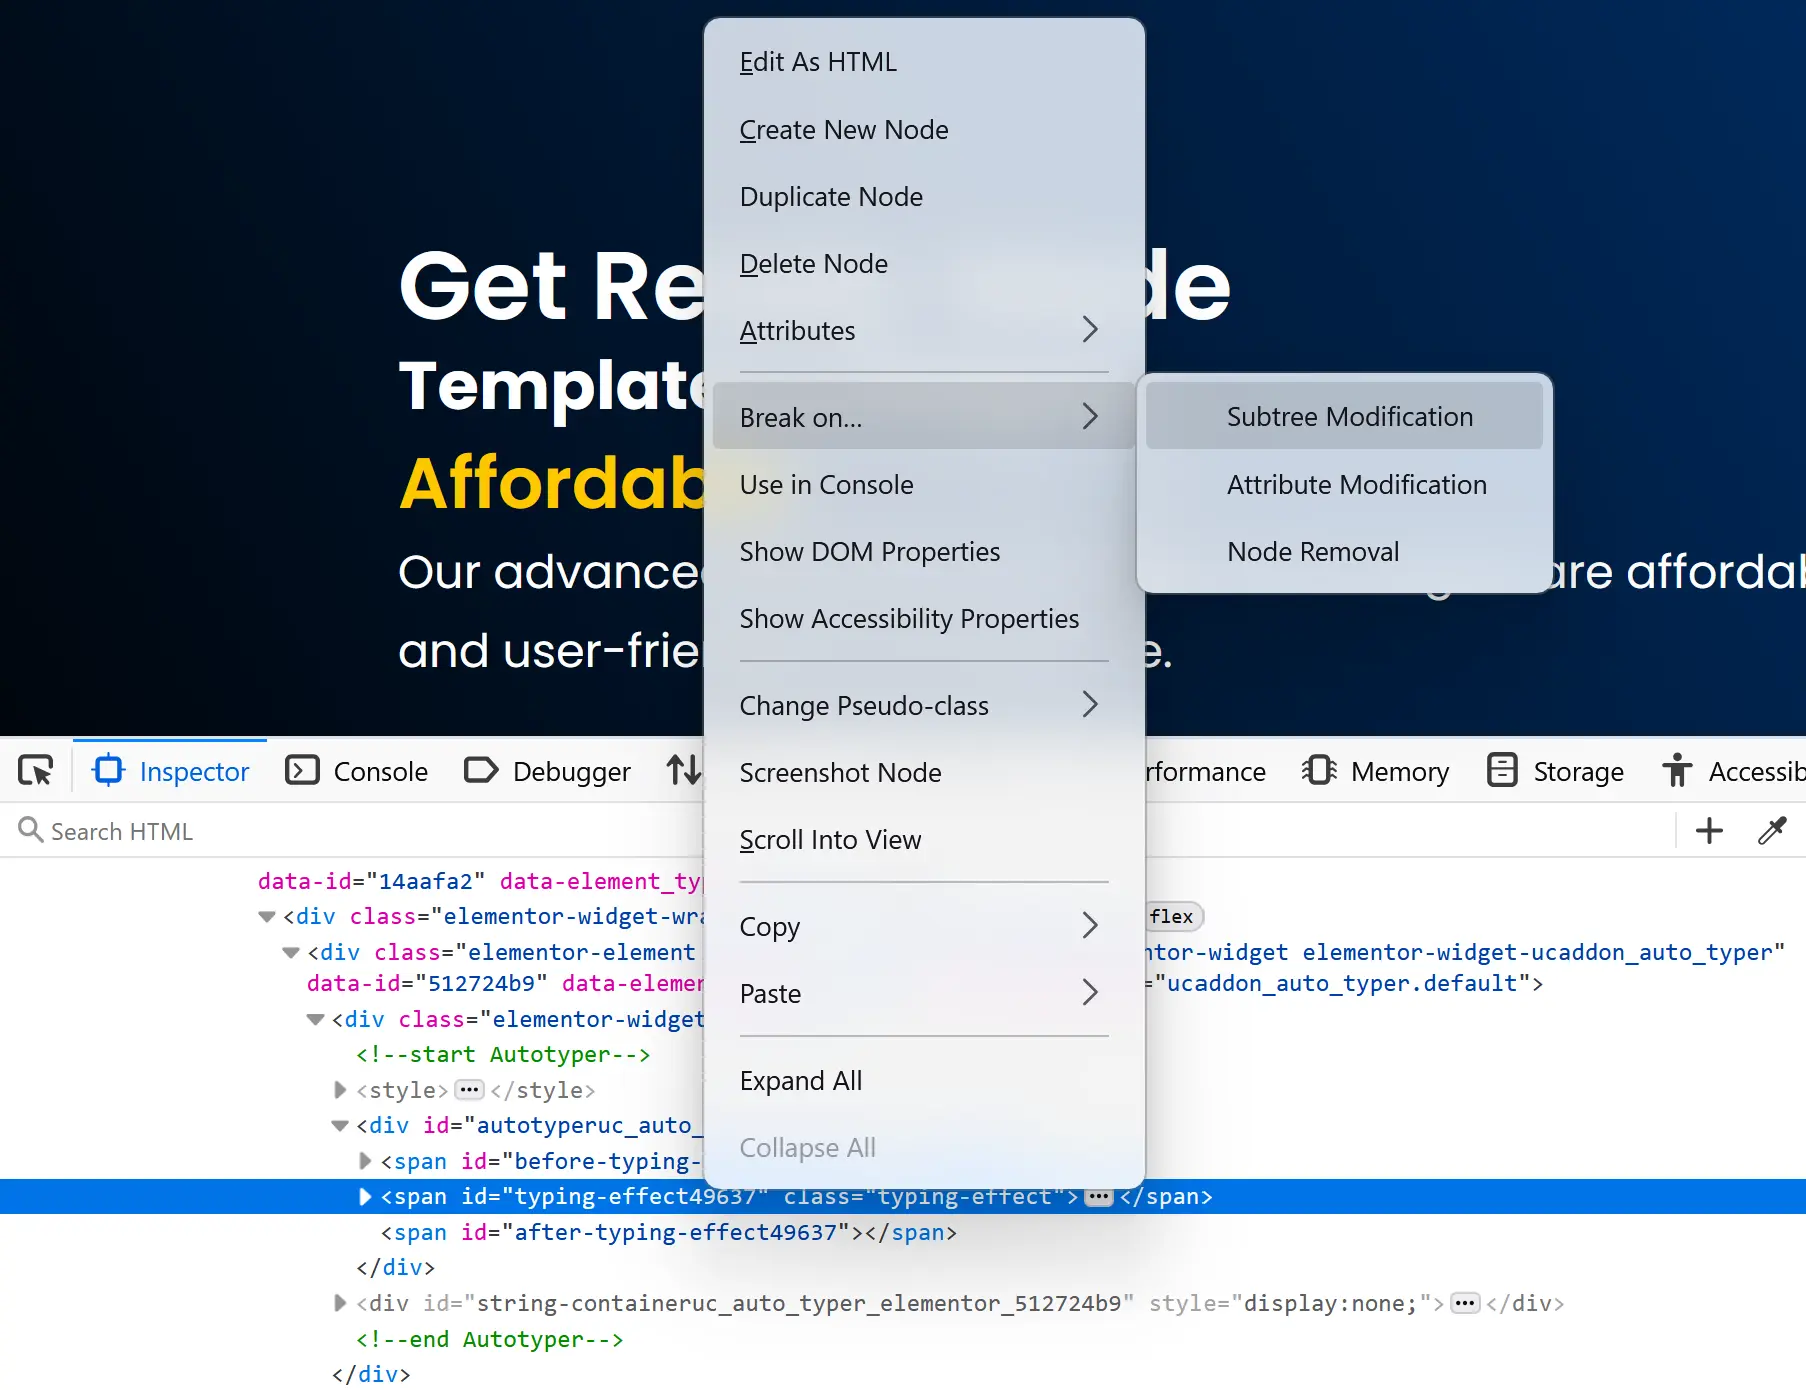
Right-click the HTML element you want to monitor.
Choose
Break on → Subtree ModificationsandAttribute Modifications🧠 “Subtree modifications” watches for changes to children (e.g., new elements), while “Attribute modifications” catches changes like
class,style, ordata-*.Now interact with the page — click buttons, hover stuff, summon dark magic
Firefox will pause the JS execution when that element is touched
The Debugger tab opens and you’re paused inside the guilty code (hopefully!)
⚠️ Sometimes it lands in jQuery or a library. Don’t panic — the real criminal is still on the Call Stack.
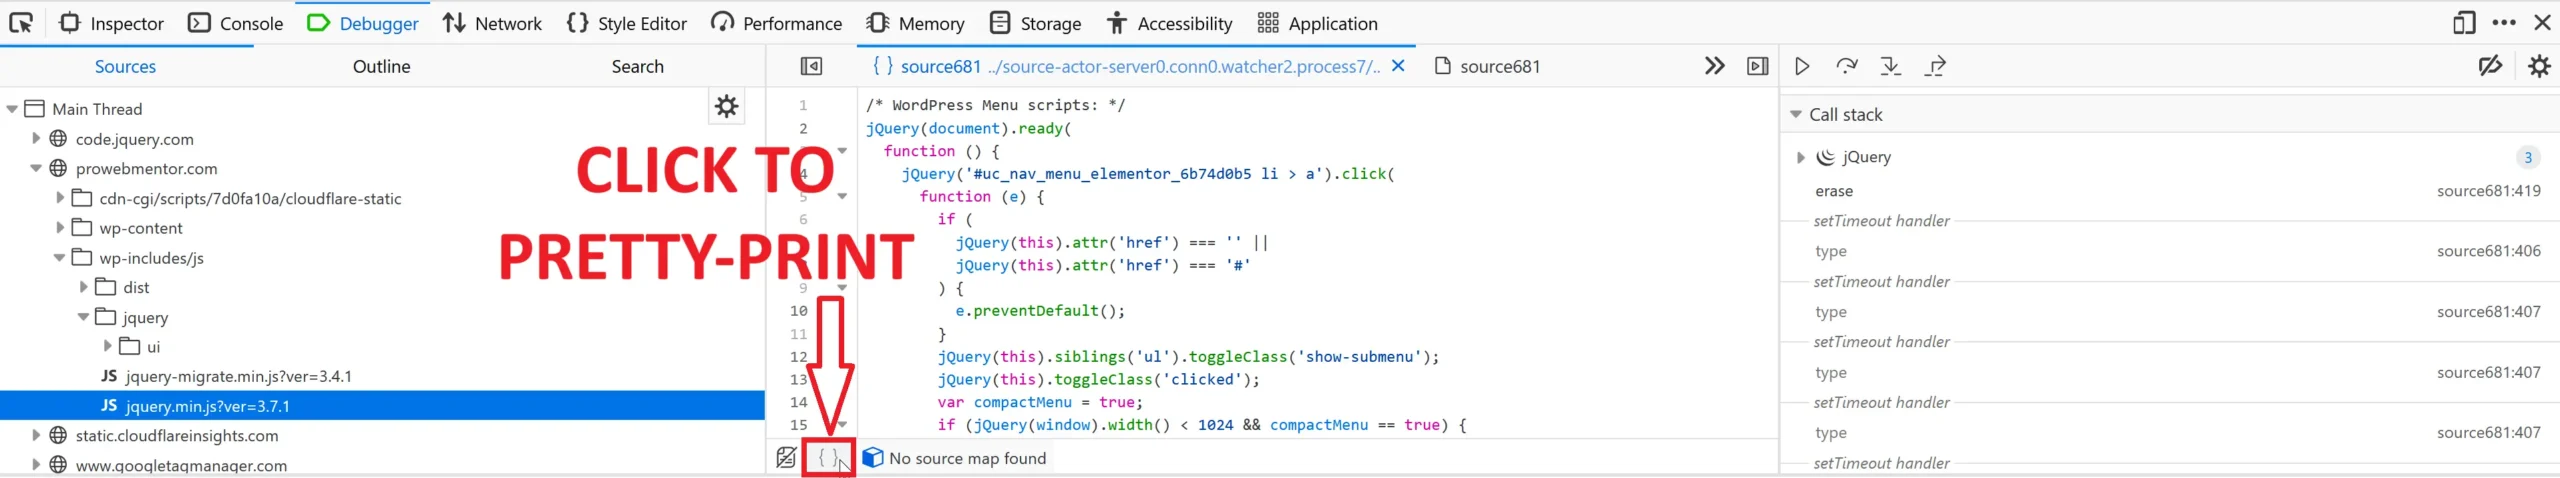
2. Use the Call Stack to Trace Actual Source Code
Often, the paused breakpoint lands inside a framework like jQuery, not your custom code. That’s expected — your code likely called the library function.
🛠️ Steps:
When paused, switch to the Debugger tab (or press
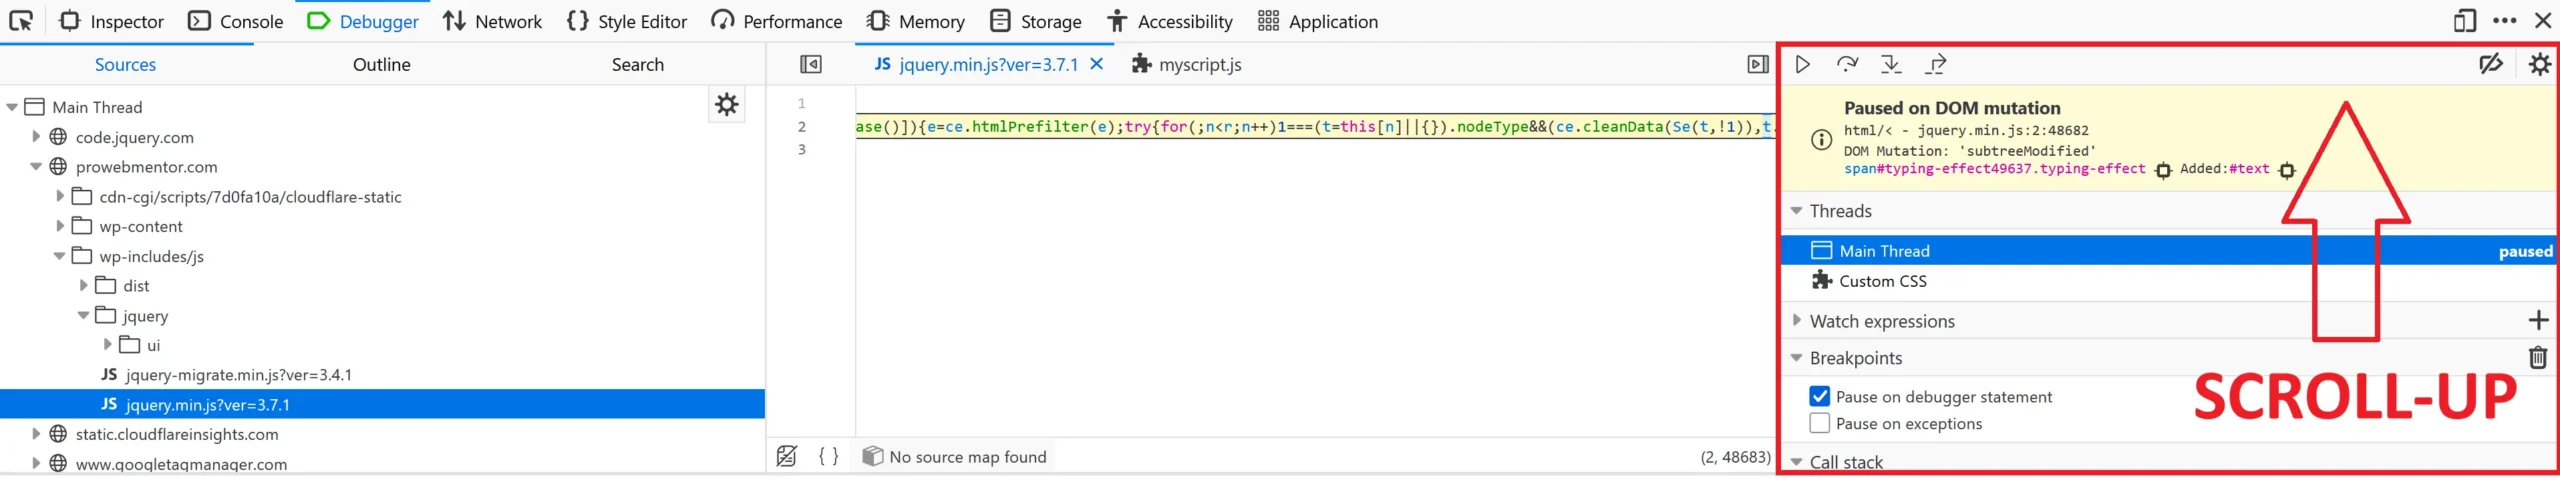
Ctrl + Shift + Z).Look at the Call Stack panel on the right.
Scroll up the stack until you find a filename you recognize (like
app.js,source681:346, orcustom.js).
4. Click that frame — it will take you to the exact line of JavaScript that triggered the DOM change.
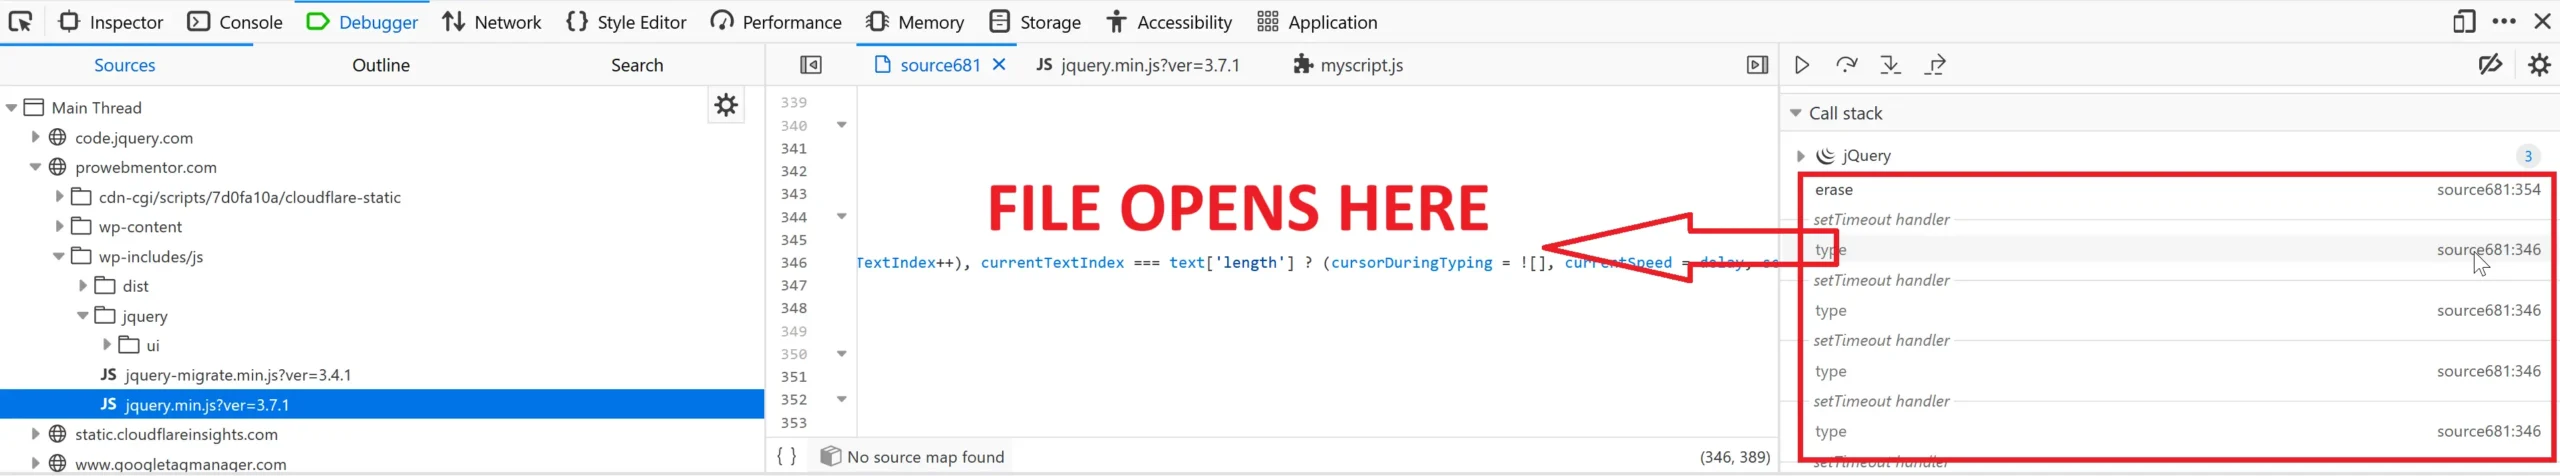
Pro Tip: If the script is minified, At the bottom left corner of the code panel, click the
{}(Pretty Print) icon to format the code.
3. Locate Specific JS Files Using Debugger Search
If you know the file name or content you want to trace, Firefox provides fast search options:
3.1 Find JavaScript File by Name
🛠️ Steps:
Press
F12to open DevToolsOpen the Debugger tab (
Ctrl + Shift + Z)
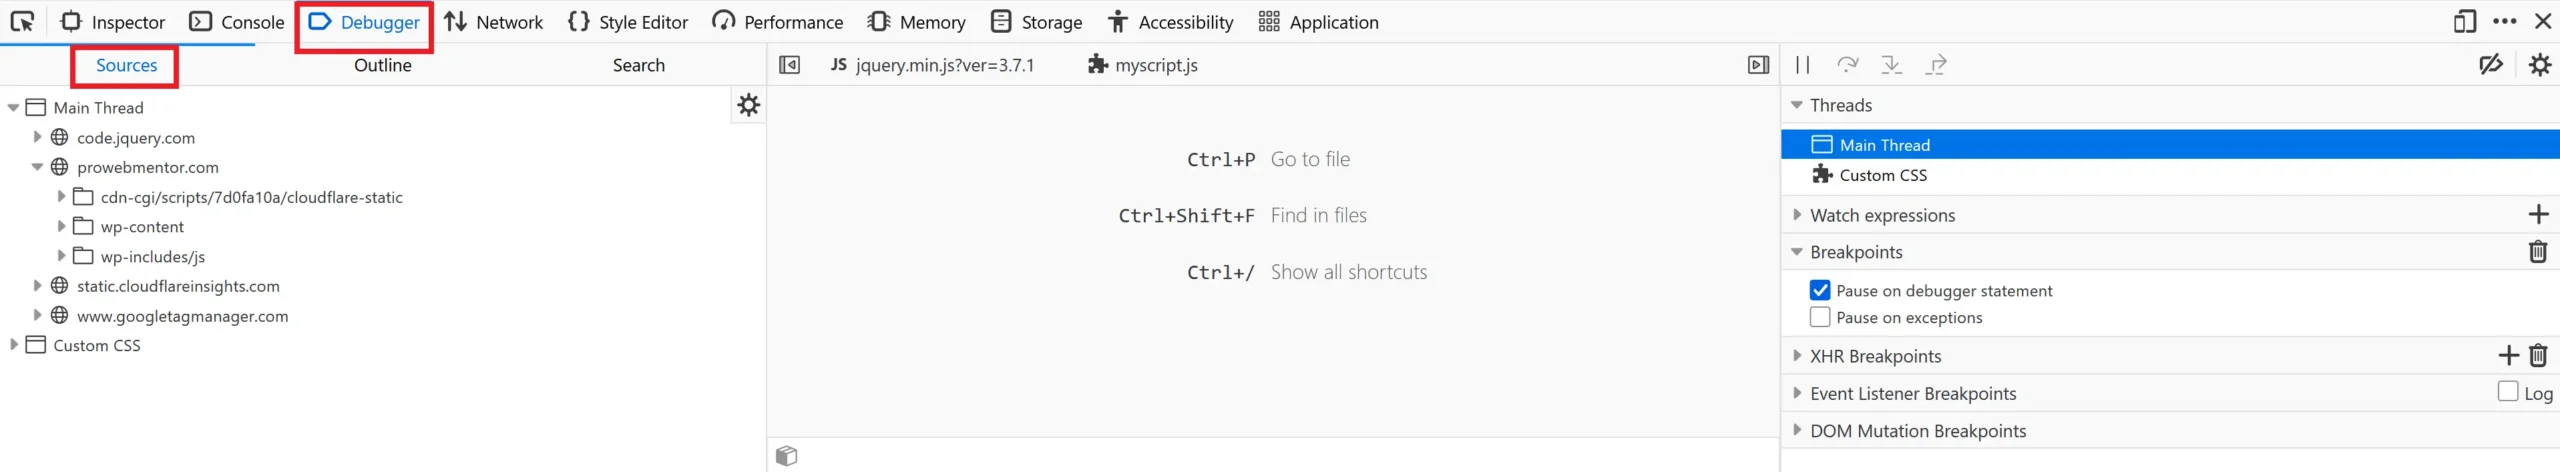
3. Press
Ctrl + P(orCmd + Pon Mac)4. Start typing the name of the JS file (e.g.,
slider.js).
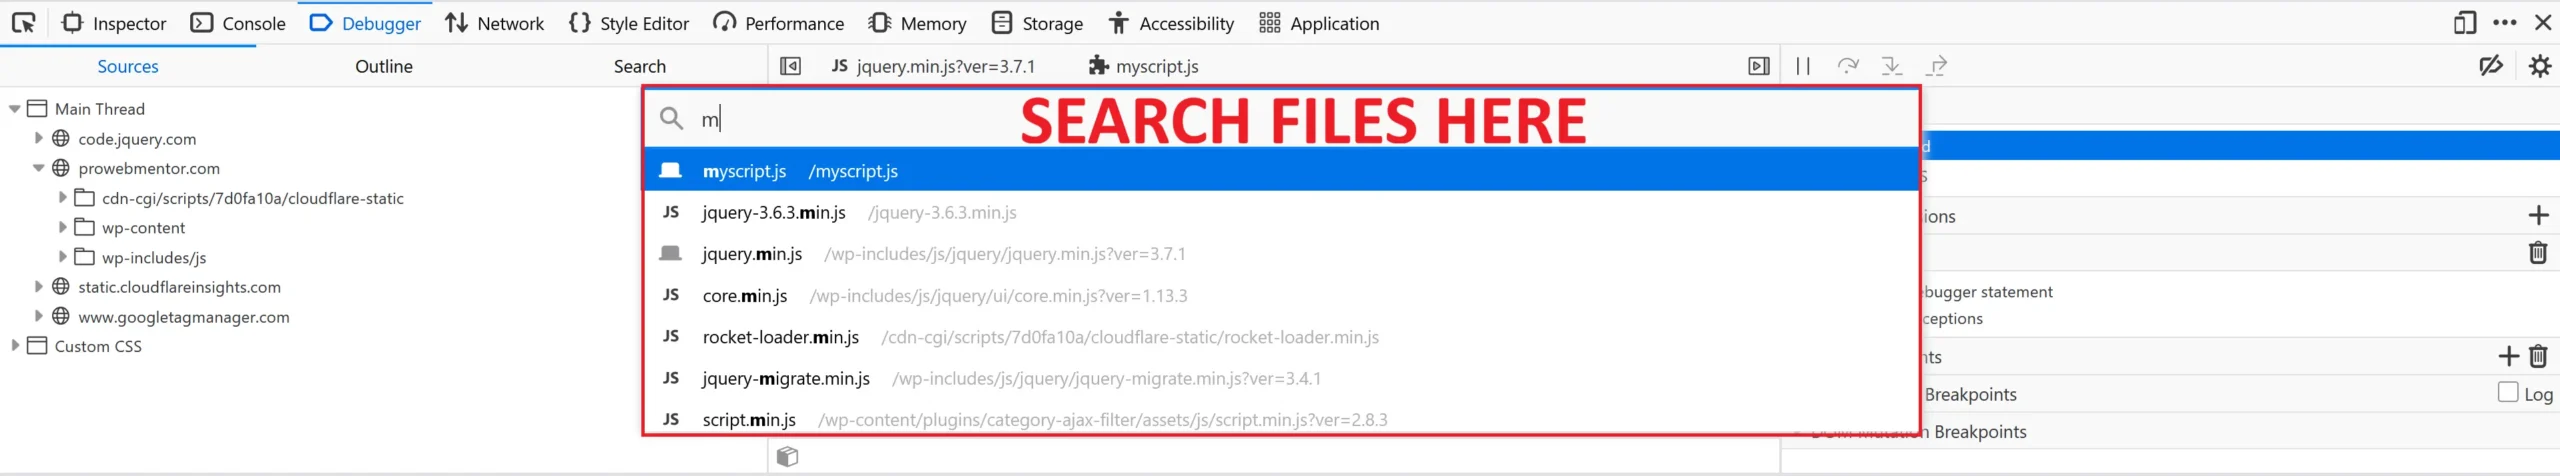
- 5. Click to open it
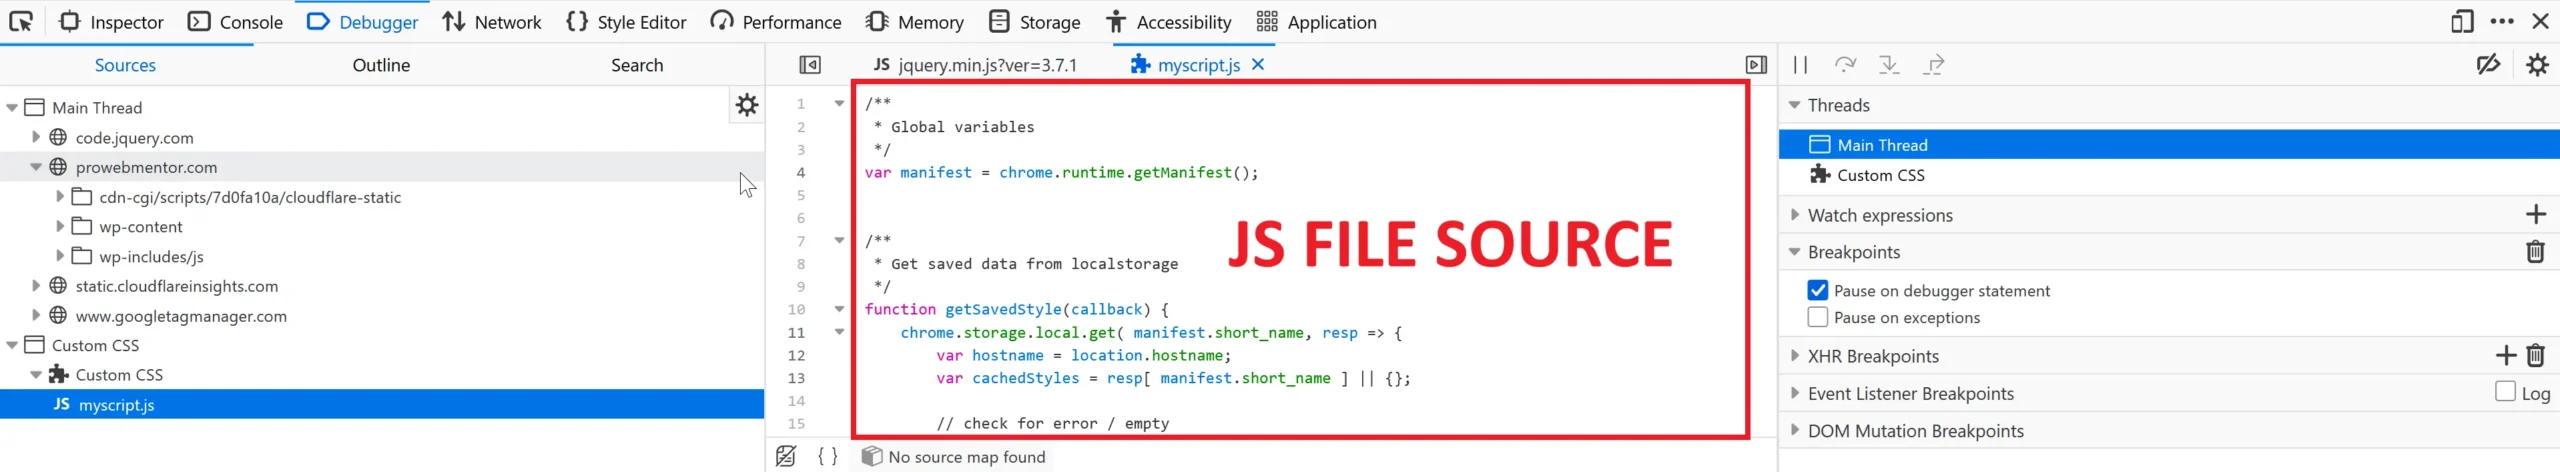
3.2 Search All JS Files by Content
🛠️ Steps:
Press
Ctrl + Shift + Fto open global searchSearch for:
typingSpeedyourVariable
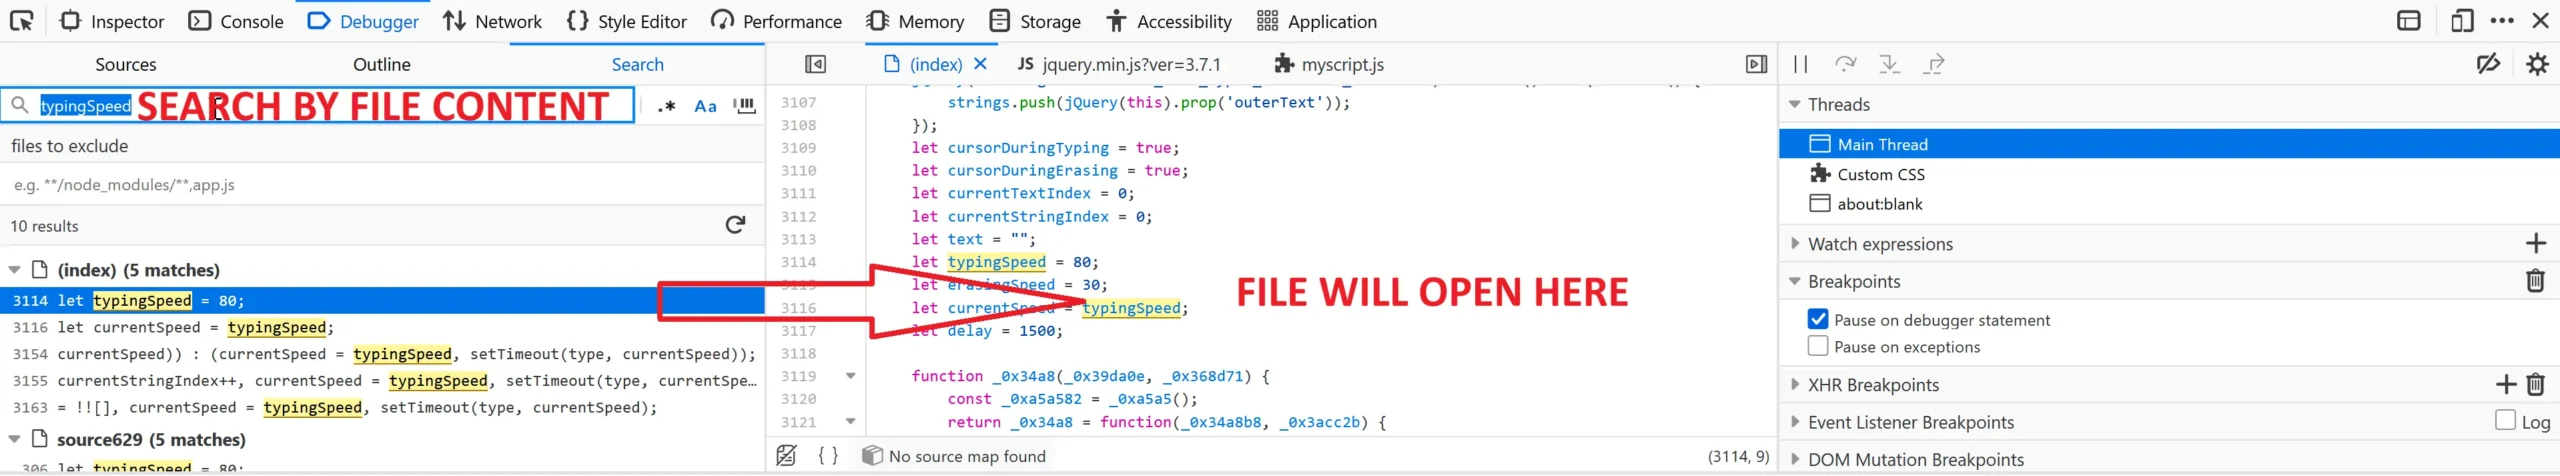
3. Click any result to jump into the JS file and see where it’s used
🧠 Final Thoughts
Finding out which JS file is controlling a DOM element is like debugging with a magnifying glass — tedious at first, but super satisfying when the bug is caught.
Combine:
🧲 Break on modifications
🧠 Stack tracing
🔍 File + content search
🧾 Pretty Print for minified code
…and you’ll solve any front-end mystery.